A real-time and historical performance management solution that supports Contact Center management and staff, whether remote, hybrid, or in the center.
Contact us to learn moreabout how Geomant Wallboard can help your business.
What
is it?
Whatis it?
Real-Time Customization: Tailor real-time monitoring experiences to align with your organization’s needs using Contact Center Key Performance Indicators.
Filtering and Calculations: Utilizing advanced filtering and calculations, performance information is customized based on criteria such as line-of-business, geography, or teams.
Integrated Data Sources: Connect to various data sources, including communications platforms, CRM systems, and Help Desks, for a holistic view of contact center operations.
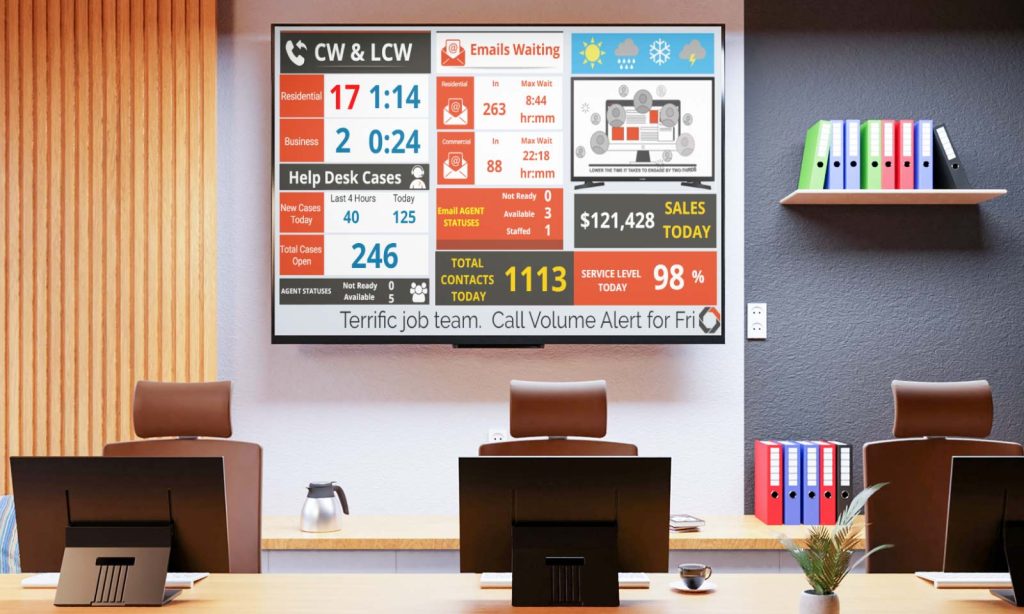
Visual Performance Representation: Transform scattered information into a meaningful visual representation of performance metrics adaptable for various platforms.
Threshold Monitoring and Alerts:Implement threshold monitoring and alerts for key performance indicators, enabling prompt responses to maintain high customer satisfaction.
One Easy-To-Use Application for All Display Types
Problem
vs. Solution
Problemvs. Solution
Here are some common concerns and issues with the day-to-day operations of a contact center and how Geomant Wallboard can deliver the solution.
Need to instantly monitor all channels of communications for response times and service levels
A unified presentation of all communications (including voice, text, or chat), promoting better response times for all customer interactions.
Need to easily see agent and management status for effective call transfer or coaching requests.
Real-time visibility of other team or management ensuring informed call handling decisions and improving the customer experience.
Need to provide awareness of critical situations without losing critical agent desktop screen space.
Customizable dashboards run in a small, dedicated desktop space and alert users when action is needed.
Need access to performance metrics that are summarized by team, geography, or other filtered criteria.
Our experts will provide an analysis of key performance indicators and how they align with the organizational structure.
Need to reduce the stress for Agents.
Incorporate engaging content and positive messages as part of the dashboard and wallboard views. Content can include employee achievements, career advancement opportunities, contests, games, and holiday activities. The positive reinforcement results in a better customer experience.
with tailored solutions designed to boost efficiency and elevate the customer experience. Your path to operational excellence and superior customer service begins here!